Spot 3–5 bpm Shifts in Your Resting Heart Rate Trends

A sustained shift from your personal baseline, not one isolated reading, is the clearest signal that something meaningful has changed. Most adults fall somewhere in the normal 60 to 100 bpm range, but your own number matters more than the population range. If you’re tracking resting heart rate trends, the practical move is simple: measure the same way each time, write down what happened around any surprising reading, confirm it before you worry about it, and call a clinician if a change is persistent or comes with symptoms.
TL;DR:
Long-term tracking of resting heart rate should focus on persistent trends over several weeks rather than isolated spikes or drops, with a change of 3 to 5 bpm sustained over two weeks warranting investigation.
Changes during sleep and wake measurements are not interchangeable; always confirm which metric your device records before comparing readings across time.
A rising trend over weeks or months increases long-term cardiovascular risk, especially if unexplained, while a trend that’s moving lower typically points to improving fitness or recovery.
External factors such as alcohol, illness, poor sleep, stress, or medication changes can cause short-term fluctuations, which usually resolve within days and are less noteworthy.
Use consistent measurement methods, annotate daily context, and compare new data to your personal baseline rather than population averages for more accurate trend interpretation.
Table of Contents
-
What Resting Heart Rate Trends Actually Mean for Fitness and Long-Term Risk
-
A Practical Workflow for Tracking Resting Heart Rate Over Time
-
How Medication and Chronic Conditions Change Resting Heart Rate Over Time
-
Reading Trends Differently: Athletes Versus Sedentary Individuals
-
Putting Resting Heart Rate Trends in Context With Other Health Metrics
Common Resting Heart Rate Patterns and What They Look Like
Once you start logging your resting heart rate for more than a few weeks, a shape starts to emerge. Most people’s data falls into one of five recognizable patterns, and knowing which one you’re looking at changes how much attention it deserves.
Stable baseline. Your number wobbles within a tight band, week after week, with no clear direction. This is the most common pattern for healthy adults whose training, sleep, and stress levels stay roughly consistent. A stable baseline is your reference point. Everything else gets compared against it.
Seasonal sway. A large longitudinal study of more than 92,000 adults found a small seasonal rhythm in resting heart rate, with a peak around January and a trough around July, averaging about 2 bpm. That’s small enough that you’d probably miss it without a full year of data, but it explains why a winter reading that looks slightly elevated compared to last summer isn’t automatically a red flag.
Gradual drop. A slow, multi-week downward drift usually reflects improving cardiorespiratory fitness. Endurance training and yoga are both associated with measurable reductions in resting heart rate over time, and the effect tends to be larger in people who started with a higher baseline. This is the pattern most fitness enthusiasts hope to see.
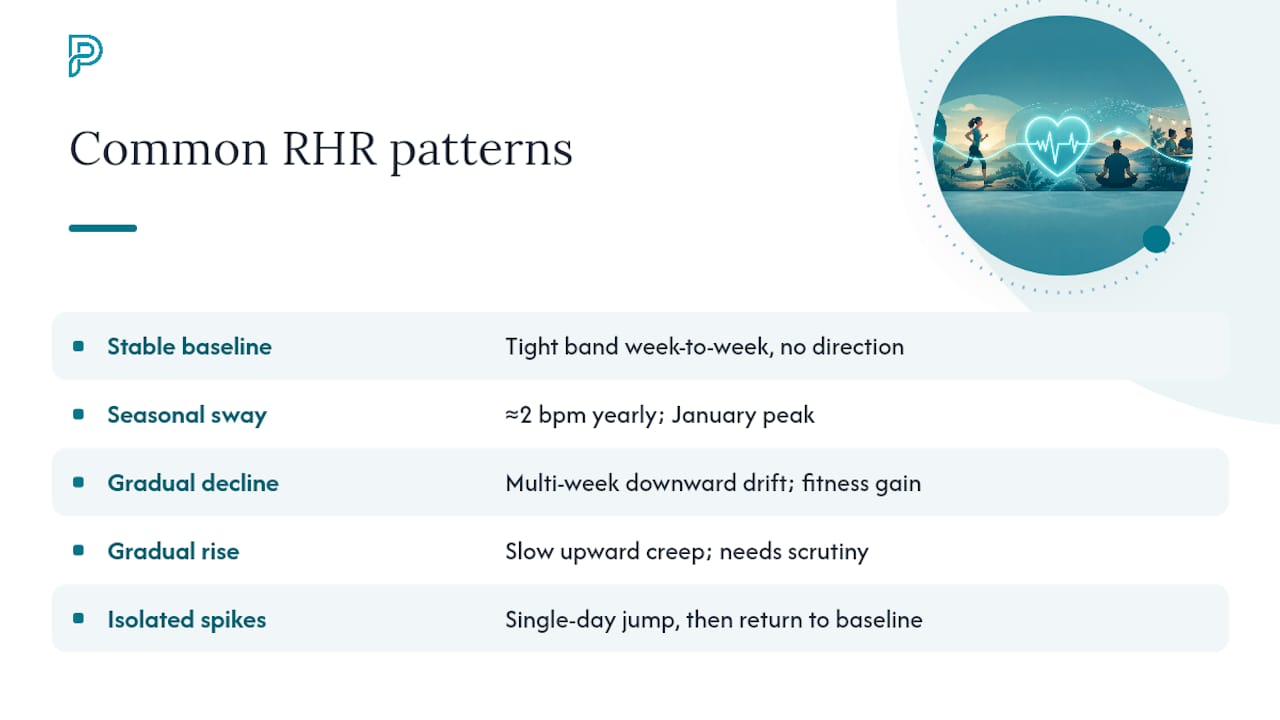
Gradual rise. The mirror image of a gradual drop: a slow upward creep over weeks or months. This deserves more scrutiny than a downward trend because it can reflect detraining, rising stress, weight gain, a new medical condition, or normal aging. Direction and persistence are what make a rising trend worth investigating, not any single day’s number.
Isolated spikes. A single day or two that jumps well above your normal range, followed by a return to baseline. These are usually explained by something specific: a rough night of sleep, a late dinner with wine, a fever, a long flight. Spikes that resolve on their own are rarely a concern.
The typical scale of week-to-week noise: In that same 92,457-person wearable cohort study, the median weekly fluctuation in resting heart rate was about 3 bpm, and one in five participants had at least one week where their reading swung by 10 bpm or more. Mean daily resting heart rate across the group averaged in the mid-60s bpm range. If your tracker shows a 6 or 7 bpm jump one week, that’s well within the range of ordinary variation, not necessarily a warning sign.
One detail that trips people up: sleep-derived resting heart rate and waking, seated resting heart rate are not the same number, and comparing across the two manufactures a false trend. Your heart rate during deep sleep is typically lower than a measurement taken while sitting quietly after waking, because parasympathetic activity dominates during sleep in a way it doesn’t once you’re upright and alert. If your wearable switched from reporting a waking measurement to a sleep-derived one, or vice versa, you might see what looks like a dramatic shift that’s actually just a change in what’s being measured. Always check which metric your device is showing before you compare weeks.
Why Resting Heart Rate Goes Up or Down
Most changes in resting heart rate trace back to a fairly short list of causes, and separating short-term triggers from long-term drivers is the single most useful skill for reading your own data.
Short-term causes tend to produce a bump that resolves within days once the trigger passes:
-
High alcohol intake and acute illness were each associated with roughly a 6% increase in heart rate in a free-living cohort study tracking lifestyle factors.
-
Menstrual cycle phase produced about a 1.6% change, enough to create a recurring monthly pattern for many people of reproductive age.
-
A single hard training session was associated with roughly a 1.3% increase, smaller than most people expect.
-
Poor sleep, acute psychological stress, caffeine late in the day, and travel across time zones all show up as short, self-limited bumps in most people’s data.
-
New medications can shift resting heart rate up or down depending on how they act on the cardiovascular or nervous system; if you started a new prescription around the same time your numbers changed, that timing is worth noting for your own records and discussing with the prescriber.
Medium and long-term drivers move the baseline itself rather than producing a temporary spike:
-
Improved fitness through endurance training or yoga is one of the best-documented drivers of a falling resting heart rate, with meta-analyses of interventional studies reporting reductions in the range of roughly 3 to 8 bpm depending on the program and the person’s age, with the largest drops in people who started with a higher baseline.
-
Meaningful changes in body weight or adiposity shift the workload on the heart at rest, and that shows up as a slow trend rather than a daily fluctuation.
-
Chronic, ongoing stress (as opposed to a single stressful day) can nudge a baseline upward over months.
-
New health shifts can also alter resting heart rate over time, which is part of why an unexplained, persistent shift is worth mentioning to a doctor rather than dismissing.
-
Aging itself plays a role, interacting with fitness level, medication use, and cardiovascular health in ways that vary a lot from person to person.
The overlap between these causes is the real challenge. A rising trend during exam season, for example, could reflect stress, worse sleep, more caffeine, and less exercise all at once. That’s exactly why a single explanation rarely tells the whole story, which is why the annotation habit described later in this article matters more than any one data point.
How and When to Measure Resting Heart Rate Accurately
Bad measurement habits are the single biggest source of manufactured trends. If your device, your posture, or your timing changes from week to week, you can end up chasing a “trend” that’s really just noise from inconsistent measurement.
Here’s a measurement approach that keeps your data comparable over time:
-
Measure at the same time relative to waking. Mayo Clinic recommends taking your pulse in the morning, before you get out of bed or start moving, as the most standardized point in your day. This avoids the influence of caffeine, breakfast, and the first stressful email you read.
-
Keep your posture consistent. Supine (lying down), seated, and sleep-derived readings are all legitimate, but they are not interchangeable. Pick one and stick with it, or note which one you’re logging each time.
-
Use the same device and the same fit. A watch worn loose on your wrist reads differently than one worn snug. If you switch from a chest strap to a wrist-based optical sensor, expect a step change in your baseline that has nothing to do with your health.
-
Confirm surprising readings manually. If a number looks unusually high or low, take a 30-second manual pulse count using two fingers on your wrist or neck, multiplied by two, before assuming the device is wrong or right.
-
Watch for device swap artifacts. A new watch, a firmware update, or even a software update to your phone’s health app can produce a sudden shift in recorded resting heart rate that looks physiological but isn’t. If an apparent trend starts on the same day you got a new device, treat it as suspect until proven otherwise.
Common measurement pitfalls worth knowing about: motion during a sleep reading, a device that lost skin contact overnight, and inconsistent windows for what counts as “resting” (some apps average an entire night; others isolate the lowest few minutes). All three can produce apparent trends that have nothing to do with your physiology.
Pro Tip: Keep a simple running note next to your heart rate log, even something as basic as “rough night,” “3 drinks,” or “flight to Denver.” That single habit turns a confusing zigzag into a readable story, and it’s the fastest way to tell a meaningful trend from ordinary noise.
What Resting Heart Rate Trends Actually Mean for Fitness and Long-Term Risk
Resting heart rate is one of the more accessible windows into cardiovascular health, but the evidence behind it comes with real caveats worth understanding before you overinterpret a single number.
On the fitness side, the Fenland study found a measurable relationship between resting heart rate and estimated cardiorespiratory fitness: a 1 bpm increase in supine resting heart rate was associated with roughly a 0.23 ml·min⁻¹·kg⁻¹ decrease in estimated VO2max over the follow-up period. That’s a small effect for any single beat, but it compounds. It also helps explain why the relationship isn’t perfectly clean. Body composition and activity level both influence the connection between resting heart rate and fitness, so two people with identical resting heart rates can have meaningfully different fitness levels depending on those factors.
-
A falling resting heart rate over months, especially alongside consistent endurance or yoga training, is one of the more reliable signs that your cardiovascular fitness is improving.
-
A rising resting heart rate that persists for weeks, without an obvious explanation like new stress or poor sleep, deserves more attention than a single elevated reading ever would.
-
Neither pattern tells you anything in isolation. Context, built from weeks of data and honest annotation, is what turns a number into useful information.
What long-term rising trajectories are associated with: An analysis built on the long-running Atherosclerosis Risk in Communities cohort found that participants whose resting heart rate rose over years had meaningfully higher adjusted risks of long-term cardiovascular problems and all-cause mortality, with some increasing trajectories associated with roughly 65% higher risk. This is observational data, not proof that a rising heart rate directly causes those outcomes. It shows an association across a large population followed over years, and it’s exactly the kind of finding that supports paying attention to a slow, sustained trend rather than any single reading.
On the training side, the meta-analytic evidence is more direct: endurance training and yoga interventions commonly produce resting heart rate reductions of several beats per minute within a matter of months, and the reduction tends to be larger in people who started with a higher resting rate. That’s a useful, actionable takeaway if you’re using resting heart rate to gauge whether a new training block is working.
Put simply: a falling trend over months is one of the more encouraging signals you can get from a wearable, most often reflecting genuine fitness gains. A rising trend, if it persists and can’t be explained by an obvious short-term cause, is worth watching more closely, not because it’s proof of a problem, but because at the population level, sustained increases correlate with higher long-term risk. Neither pattern replaces a conversation with a clinician who has your full history. Heart rate variability adds a complementary layer here too. HRV tends to respond faster to acute stress, while resting heart rate is generally the better metric for tracking fitness shifts and slower-moving change, which is worth understanding if you’re deciding which number to weight more heavily on any given day.
When to Act and When to See a Clinician
Most fluctuations in resting heart rate don’t need a doctor’s visit. Certain patterns do, and knowing the difference saves you both unnecessary worry and unnecessary delay.
Contact a clinician if you notice any of the following:
-
A persistent, unexplained rise that continues for several weeks without an obvious cause like new training, poor sleep, or added stress.
-
A resting heart rate that consistently sits above 100 bpm, which falls outside the typical adult range and warrants evaluation, especially if it’s a new pattern for you.
-
A low resting heart rate accompanied by symptoms like dizziness, fainting, or unusual shortness of breath, is worth a clinician visit, rather than a low number alone (which can simply reflect good fitness in athletes).
-
Recurrent, unexplained spikes that keep returning even after you’ve checked the usual suspects like alcohol, illness, or poor sleep.
When you do go in, bring more than a single number. A multi-week time series is far more useful to a clinician than one dramatic reading, especially when it’s annotated with context: sleep quality, illness episodes, medication changes, and any symptoms you noticed along the way. That kind of record helps a clinician spot a pattern quickly instead of starting from scratch.
This article is educational information to help you understand your own data. It isn’t a substitute for an evaluation from your healthcare provider, and only a clinician who knows your history can decide whether testing or treatment is appropriate for changes you’re seeing.
A Practical Workflow for Tracking Resting Heart Rate Over Time
Turning raw daily numbers into a trend you can actually trust takes a bit of structure. Here’s a workflow that works whether you’re doing it by hand in a notes app or with a tool built for the job.
-
Collect comparable readings for three to six weeks. Same time of day, same posture, same device, before you try to draw any conclusions. This window establishes your personal baseline, which matters more than any published range.
-
Compute a rolling 7-day median alongside a 30-day moving average. Daily numbers are noisy. Rolling averages smooth that noise out and make real shifts visible against the background chatter.
-
Annotate every day with context that could plausibly move the number: sleep quality, illness, alcohol, travel, menstrual cycle phase, and training load. This single habit is what separates a useful log from a confusing zigzag.
-
Compare your current window to your established baseline, not to a generic population range. A 5 bpm rise from your personal norm of 55 bpm means something different than a 5 bpm rise from a norm of 70 bpm.
-
Check for device artifacts before assuming a physiological cause. If a shift lines up with a new watch, a firmware update, or a change in how your app calculates “resting,” treat that as the likely explanation first.
-
Consult a clinician if the shift is persistent, unexplained, or accompanied by symptoms, using the red flags described above as your guide.
As a practical threshold, a change of roughly 3 to 5 bpm that holds steady across a rolling average for two or more weeks is generally worth noting and investigating for context. A single-day spike of that size, especially one that resolves within 48 hours, usually isn’t.
This is where a tool built for exactly this kind of pattern recognition earns its place. Panora Health imports wearable data from Apple Health, Oura, WHOOP, and Garmin, and turns the raw numbers into plain-language trend summaries instead of leaving you to eyeball a jagged line graph. Its AI coach can prompt you to log the context, like sleep, alcohol, travel, or training, that makes an isolated spike make sense instead of triggering needless worry, and its health insights library covers related topics like how sleep affects recovery metrics if you want to go deeper on any one contributing factor.
Pro Tip: Before any appointment where heart rate or cardiovascular health might come up, export or screenshot your annotated multi-week trend rather than just your most recent reading. Clinicians consistently find a labeled time series far more useful than a single number recited from memory.
The Impact of Age and Gender on Resting Heart Rate Trends
Resting heart rate shifts gradually across the lifespan, and the 92,457-person longitudinal cohort that tracked age, sex, sleep, and BMI alongside daily heart rate found measurable associations with both age and sex, on top of the seasonal and weekly variation already discussed. That means the “normal” range isn’t static for any one person. It shifts slowly across decades, which is one more reason a personal baseline established a few years ago might not be the right comparison point today.
Sex differences in resting heart rate show up consistently across large datasets, though the size of the difference varies by study and by age group. Hormonal cycles add another layer for people of reproductive age. Annotating menstrual cycle phase is often enough to explain a recurring monthly pattern that would otherwise look like an unexplained fluctuation, and some cycle-tracking tools rely on exactly this kind of daily heart rate signal to detect phase changes reliably.
The practical takeaway is the same one that runs through this entire topic: don’t compare your number to a generic chart built for a different age group or a different sex. Compare it to your own history, and expect that history to shift slowly as you age. A gradual multi-year drift that would look dramatic in a two-week window can be entirely unremarkable when viewed against a decade of normal, age-related change.
How Medication and Chronic Conditions Change Resting Heart Rate Over Time
Certain prescription medications are well known to raise or lower resting heart rate as part of how they work, and a chronic condition itself, separate from any medication treating it, can also shift your baseline over months or years. Certain health shifts are documented drivers of altered resting heart rate, part of why a persistent, unexplained change is worth mentioning to a doctor rather than writing off as stress or bad sleep.
This is squarely a conversation for you and your prescribing clinician, not something to self-diagnose from a wearable graph. If your resting heart rate trend shifted around the same time you started, stopped, or changed the dose of a medication, that timing is a useful detail to bring up at your next appointment. Don’t adjust anything yourself based on a heart rate reading alone.
The practical habit that helps most here is the same annotation discipline described earlier: note medication changes on the same timeline as your heart rate log. A step change in your baseline that lines up exactly with a new prescription start date is a very different story than a gradual drift with no clear trigger, and having both timelines side by side makes that distinction obvious to anyone reviewing your history, including you.
Reading Trends Differently: Athletes Versus Sedentary Individuals
The same resting heart rate number carries a different meaning depending on someone’s training history, which is part of why population ranges are a starting point rather than a verdict. Very fit endurance athletes commonly have resting rates near 40 bpm, a number that would prompt concern in someone with no training background but reflects an efficient, well-conditioned heart in a trained one.
For athletes, a slowly falling resting heart rate across a training block is usually a welcome sign of improving fitness, in line with the reductions seen in exercise intervention studies. A sudden rise during a heavy training period, on the other hand, can be an early sign of overreaching or inadequate recovery, worth cross-checking against sleep quality and training load rather than dismissed.
For sedentary individuals, the interpretation runs differently. A falling resting heart rate that coincides with starting a new activity habit is an encouraging, measurable sign of adaptation. A rising trend with no clear explanation carries more weight in this group, since there’s no heavy training load to point to as the likely cause. In both cases, the direction and persistence of the trend matter more than where the number happens to sit on a chart, and comparing an athlete’s baseline to a sedentary person’s chart, or vice versa, is a common way people misread their own data.
Putting Resting Heart Rate Trends in Context With Other Health Metrics
Resting heart rate tells a fuller story when it’s read alongside other data you’re already tracking, rather than in isolation. Heart rate variability is the most natural companion metric: HRV tends to react faster to acute, single-day stress, while resting heart rate trends are generally better suited to tracking slower shifts in fitness and health over weeks and months. Looking at both together helps you tell short-term noise from a genuine trend.
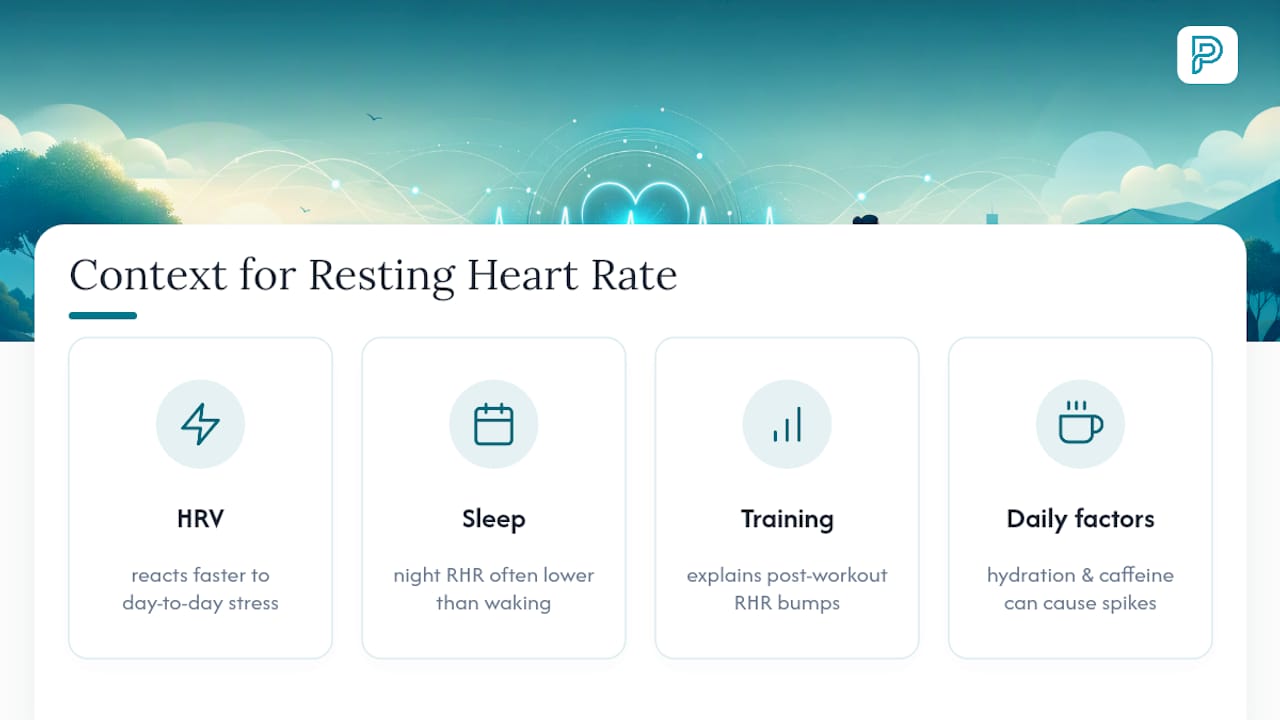
Sleep data adds another dimension worth cross-referencing. Because sleep-derived resting heart rate typically runs lower than a waking measurement, a night of poor or fragmented sleep can shift the next day’s reading in ways that have nothing to do with cardiovascular health. Training load and soreness logs help explain the smaller, expected bumps that follow a hard workout, while hydration and caffeine intake are common, easy-to-overlook contributors to a day-to-day spike.
The goal isn’t to track every metric with equal intensity every day. It’s to have enough context on hand that when your resting heart rate does something unexpected, you can check two or three obvious explanations before assuming something’s wrong. A single elevated morning reading means very little on its own. The same reading, paired with a rough night of sleep, three drinks the evening before, and a hard training session two days earlier, tells a complete and reassuring story.
Track Your Trends With Panora Health
Reading resting heart rate trends well takes consistent measurement, patient annotation, and a way to see the pattern instead of just the daily number. That’s a lot to manage across a wearable app, a notes file, and your memory of what happened last Tuesday.
Panora Health brings your wearable data, blood work, sleep, recovery, training, and daily check-ins into one place, so the context that explains a heart rate shift lives right next to the number itself instead of scattered across three different apps. It imports data from Apple Health, Oura, WHOOP, and Garmin, and its AI coach can answer plain-language questions about your own logged data. If your resting heart rate ticked up this week, you can ask what else changed instead of digging through separate logs. For anyone who wants a tool-assisted version of the tracking workflow described in this article rather than a spreadsheet built from scratch, Panora is built for exactly that. Download the app for iOS and connect your wearable to start building your own baseline instead of guessing against a generic chart.
This article is general information, not a substitute for advice from a qualified doctor. Consult a qualified healthcare professional about your own circumstances before acting on anything here.
FAQ
Why Is My Resting Heart Rate Trending Down?
A falling resting heart rate over weeks or months most often reflects improving cardiovascular fitness, particularly if you’ve started or increased endurance training or yoga, both of which are linked to measurable reductions in resting heart rate over time. It can also reflect weight loss, better sleep, or reduced stress. If the drop is sudden and paired with dizziness or fatigue rather than gradual and symptom-free, mention it to a clinician.
Why Is My Resting Heart Rate Trending Up?
A rising trend is often explained by short-term factors like poor sleep, high alcohol intake, illness, or added stress, all of which are associated with measurable short-term increases in heart rate. If the rise persists for weeks without an obvious cause, it’s worth tracking closely and mentioning to a clinician, since long-term rising trajectories are associated with higher cardiovascular risk at the population level.
Is Your Resting Heart Rate Supposed to Fluctuate?
Yes. A large cohort study found a typical median weekly fluctuation of about 3 bpm, with roughly 20% of people experiencing at least one week with a 10 bpm swing or more. Day-to-day and week-to-week variation is normal; it’s a persistent, sustained shift over multiple weeks that deserves closer attention.
What Is a Good Resting Heart Rate by Age?
There isn’t a single universal chart, since resting heart rate is influenced by age, sex, fitness level, and other individual factors. Most healthy adults fall within the 60 to 100 bpm range, with well-trained athletes often sitting near 40 bpm, but your own established baseline is a far more useful reference point than any age-based table.
How Much Does Panora Health Cost?
Current pricing for Panora Health is available directly on the app’s website rather than published in this article. The app is available for iOS now, with Android support planned.
Recommended
-
HRV Explained: What Your WHOOP Recovery Score Is Actually Telling You
-
The Sleep-Recovery Connection: Why Duration Isn’t Everything
This article is educational general-wellness information, not medical advice. Panora Health is a General Wellness product, not a medical device. Discuss your own lab results and health questions with a qualified clinician.
Panora Health AI provides wellness information, not medical advice. This is not a substitute for professional medical diagnosis or treatment. Always consult a qualified healthcare provider before making health decisions.